| |
|
|
 |
| (Home) |
| Aim & scope |
| Why a contest on 3D MLS data? |
|
| |
|
Nowadays, LiDAR technology ("light detection and ranging") has been prospering in the remote sensing community. We can find several developments such as: Aerial Laser Scanning (ALS), useful for large scale buildings survey, roads and forests; Terrestrial Laser Scanning (TLS), for more detailed but slower urban surveys in outdoor and indoor environments; Mobile Laser Scanning (MLS), less precise than TLS but much more productive since the sensors are mounted on a vehicle; and more recently, ``stop and go'' systems, easily transportable TLS systems making a trade off between precision and productivity.
Thanks to all these technologies, the amount of available 3D geographical data and processing techniques has bloomed in recent years. Many semi-automatic and automatic methods aiming at analyzing 3D urban point clouds can be found in the literature. It is an active research area. However, there is not a general consensus about the best detection, segmentation and classification methods. This choice is application dependent. One of the main drawbacks is the lack of publicly available databases allowing benchmarking.
In the literature, most available urban data consist in close-range images, aerial images, satellite images but few MLS datasets (ISPRS data, IGN data). Moreover, manual annotations and algorithm outputs are rarely found in available 3D repositories. Some annotated 3D MLS datasets publicly available are the Oakland 3D point cloud dataset, and the Paris-rue-Madame dataset.
In this context, we aim at stimulating researchers from different fields such as Computer Vision, Computer Graphics, Geomatics and Remote Sensing, working on the common goal of processing 3D data, benchmarking segmentation and classification methods working on 3D MLS data. This will provide a ground for cross-fertilization and discussions on the future challenges in this important research area.
The benchmark is carried out by the MATIS Lab of the French National Mapping Agency (IGN) and the Center for Mathematical Morphology (CMM-MINES ParisTech) in the framework of the TerraMobilita and IQmulus projects and is part of the IQmulus processing contest.
The first results of the contest have been presented at the IQmulus workshop that took place on July 8th, 2014 in Cardiff (UK), in conjunction with SGP’14.
|
| (Home) |
| Contest description |
| Dataset specifications |
|
| |
|
The database contains 3D MLS data from a dense urban environment in Paris (France), composed of 300 million points. The acquisition was made in January 2013.
This database is produced in the framework of the iQmulus and TerraMobilita projects. It has been acquired by Stereopolis II, a MLS system developed at the French National Mapping Agency (IGN). Annotation will be carried out in a manually assisted way by the MATIS laboratory at IGN.
In this database, the entire 3D point cloud is segmented and classified, i.e. each point contains a label and a class. Thus, point-wise evaluation of detection-segmentation-classification methods becomes possible.
- The datasets and their processing results must be presented in PLY format with little endian encoding.
- All coordinates are geo-referenced (E,N,U) in Lambert 93 and altitude IGN1969 (grid RAF09) reference system, reflectance is the laser intensity. An offset has been subtracted from the XY coordinates with the aim of increasing data precision: X0 = 649000 m and Y0 = 6840000 m.
Each file contains the following attributes:
- (float32) X,Y,Z: Cartesian geo-referenced coordinate in the Lambert 93 system.
- (float32) X,Y,Z origin:
- (float32) reflectance: backscattered intensity corrected for distance.
- (uint8) num_echo: number of the echo (to handle multiple echoes)
- Each processed file, provided by each participant, must be a PLY file containing the original points (IN THE SAME ORDER!!!), their original attributes and the two following additional attributes:
- (uint32) id: containing an unique identifier/label for each segmented object.
- (uint32) class: containing the classification result for each segmented objects using the labels from the Semantic class tree . Two points having the same id must have the same class.
- Since each point of the dataset contains an id and a class, the evaluation will be carried out in a point-wise way.
|
| (Home) |
| Segmentation & Classification |
|
| |
|
Each individual objects has been manually annotated in the 3D dataset by IGN personnel using a web based editor developped by IGN that you can try here . All the 3D points belonging to the same object will have the same object identifier (id). Thus, the number of different ids in the 3D point cloud corresponds to the number of objects.
In the classification step, a category is assigned to each segmented object. Each class represents an urban semantic entity, as defined in the following subsection.
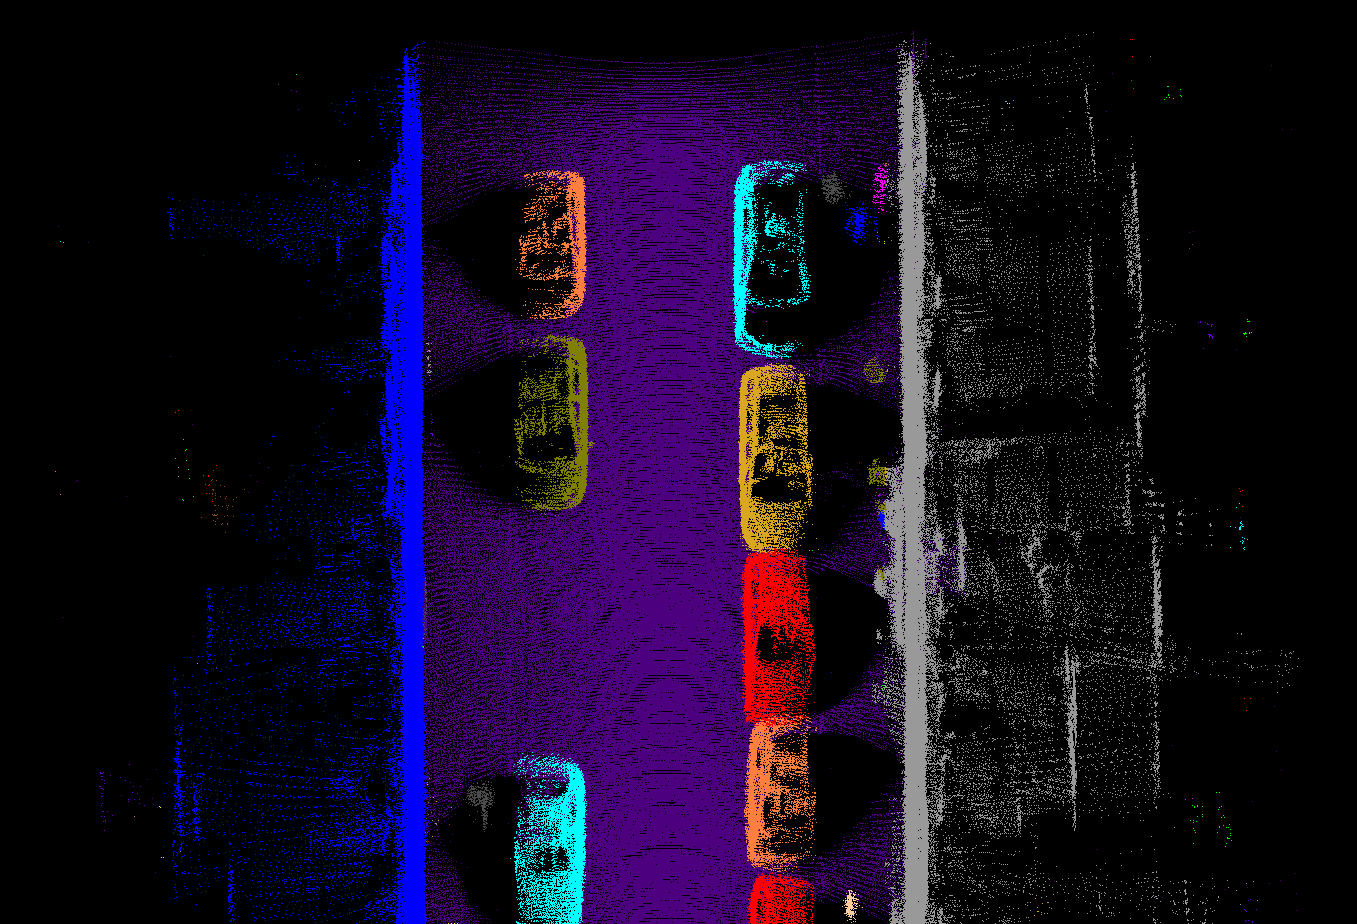
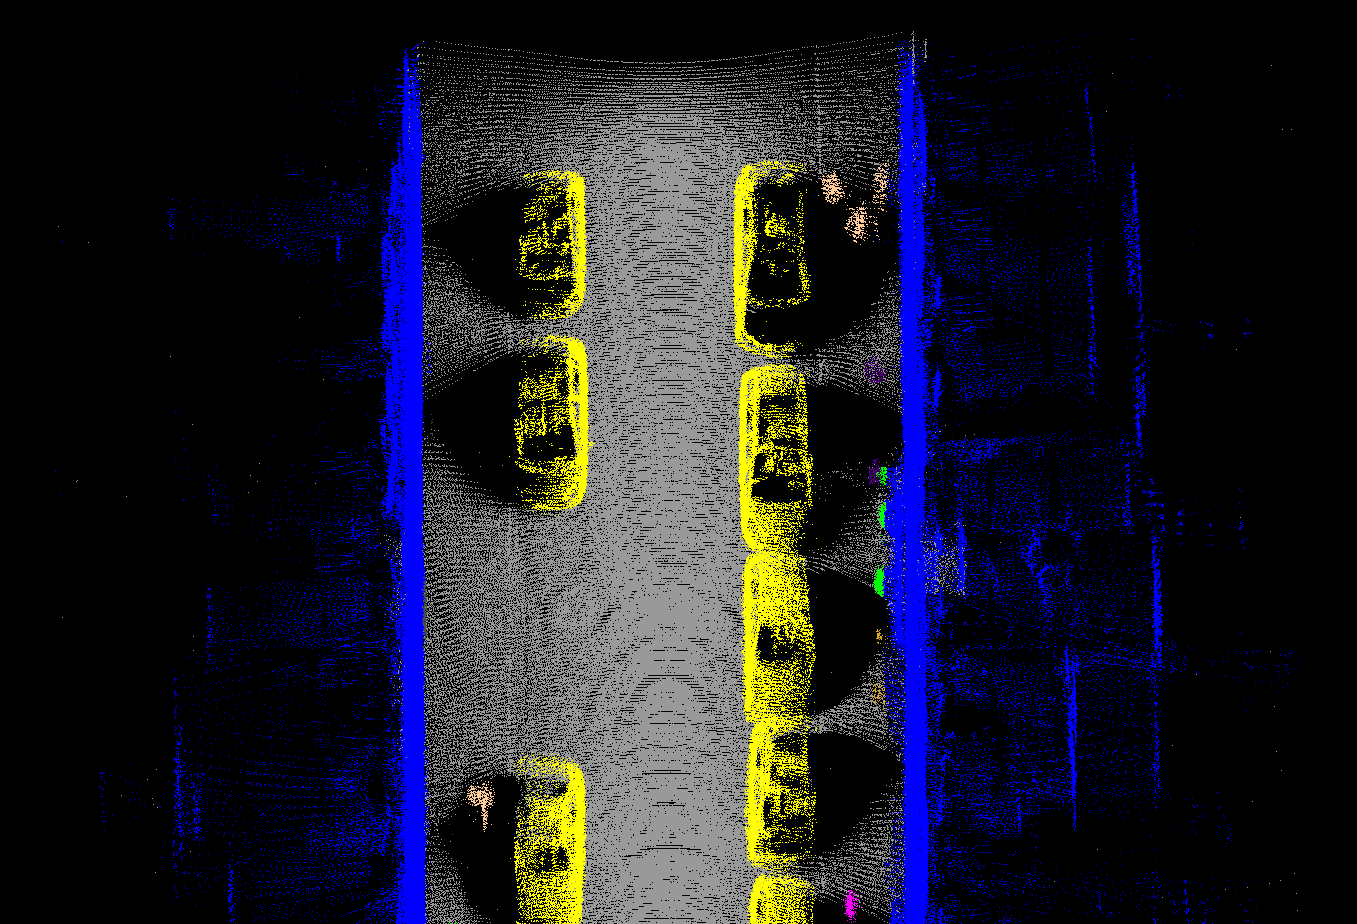
The following figures show an example of labels and classes on a 3D point cloud. In the left image, note that ground, facades, pedestrians and cars are represented with different colors because they are different objects and have different labels. In the right image, the colors represent the object classes: ground in gray, facades in blue, cars in yellow, pedestrians in skin color, and furniture in red and cyan.
If two points have the same label, they must have the same class.
|
| (Home) |
| Available classes in the database |
|
| |
|
In this contest, a hierarchy of semantic classes has been defined. The class tree is downloadable as an xml file and is composed as follows:
The tree is voluntarily very detailed as we aim at producing a ground truth that can be usefull to a wide range of methods. Participants can choose the classes that they want in this tree and the evaluation will be performed accordingly.

|
| (Home) |
| Evaluation |
| Evaluation strategy specifications |
|
| |
|
The benchmark does not aim at ranking the participants but at providing insights on the strengths and weaknesses of each methods. We consider that the quality of a method is subjective and application dependent, and the results of this benchmark should only help a user choosing one approach depending on its own specific requirements. Results will be evaluated at three levels: as a classification, as a detection and as a segmentation. Details of the evaluation metrics used are given in the Evaluation Protocol document.
|
| (Home) |
| Participate |
| How to take part in the contest? |
|
| |
|
The benchmark is now open and functional. To take part:
Download the Learning dataset if your method needs learning data. It contains a fully annoted street section 200 m long (12 million points).
Download the ten zones of the benchmark: Zones 0-4 Zones 5-9
Run your algorithm on the ten zones
Send a mail to Bruno Vallet for details on uploading your results
|
| (Home) |
| Licence |
| Your obligations when using the data |
|
| |
|
This dataset is available under the Creative Commons Attribution Non-Commercial No Derivatives Licence CC-BY-NC-ND-3.0 . Whenever this dataset is involved, the user of this dataset must in every result he distributes, including any scientific or technical publication or any display of an image of the dataset on a digital or on an analog media
Provide the dataset title : "IQmulus & TerraMobilita Contest"
Cite the following journal paper :
Bruno Vallet, Mathieu Brédif, Andrés Serna, Beatriz Marcotegui, Nicolas Paparoditis. TerraMobilita/IQmulus urban point cloud analysis benchmark. Computers and Graphics, Elsevier, 2015, Computers and Graphics, 49, pp.126-133. https://hal.archives-ouvertes.fr/hal-01167995v1
|
| (Home) |
| Contact us |
|
| |
|
In order to keep informed about the potential modifications or to give some feedback about this iQmulus TerraMobilita Contest, please contact Bruno Vallet


|
|
| |
|
|